How To Chart Scale Operations For Azure App Services And Function Apps
- 20 May 2020
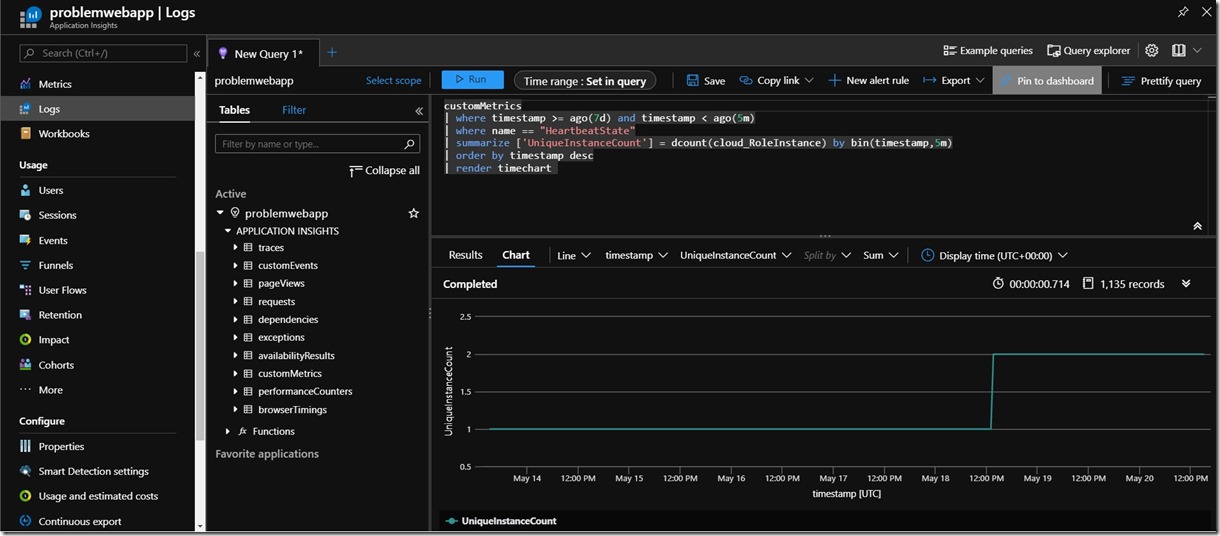
Application Insights is a powerful tool to visualize what is happening with your application. This quick query shows how to chart when instances are added and removed
Walkthrough
Enable application insights for your app using the wizard in the portal or follow our documentation: https://docs.microsoft.com/en-us/azure/azure-monitor/app/azure-web-apps?tabs=net#enable-agent-based-monitoring
Open Application Insights from the app of concern from the portal and use a time based query similar to this
customMetrics
where timestamp >= ago(7d) and timestamp < ago(5m)
where name == “HeartbeatState”
summarize [‘UniqueInstanceCount’] = dcount(cloud_RoleInstance) by bin(timestamp,5m)
order by timestamp desc
render timechart
Then you can use ‘Pin to dashboard’ to save this view!
Note that the default time period for charts will be 24 hours but you can change this by clicking on the … and setting a custom time range:
Drop me a note if you found this useful!
Jeff
<< Go Back
